Airflow to Snowflake to dbt to Plotly Dash

What I Built:
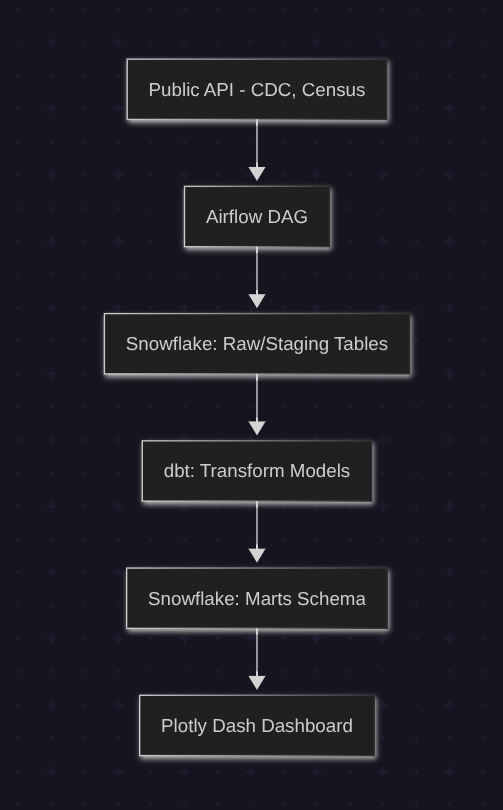
I set out to build an end-to-end data pipeline that drinks from a given API as if it were a milkshake (Airflow), then pipes that data into a data warehouse (Snowflake), and operates on that data with dbt enough to bring insights into a dashboard (Plotly Dash).
Why It Matters
Improving my skills at API-to-Warehouse-to-Dashboard workflows is important to me because this is a fundamental flow to watch how data changes over time. I'm building to learn, to study, and to improve my own systems.
How It Works
What Worked
Airflow ran the show. I dockerized the DAGs to check API availability, pull the data, and move it through each stage of the pipeline. I've been doing all of this manually until now, but Airflow makes it much easier and robust.
Snowflake handled the raw and staged data like a boss, with separate schemas that made it easy to track what was landing where.
dbt did its thing: turning messy raw data into clean, tested models.
Plotly Dash sat on top and queried Snowflake directly. It gave me a fast, clean way to surface COVID-19 and census trends in real-time — with no need for Grafana or other observability or BI tools, just keeping it in python. How much I enjoyed Plotly Dash was the biggest surprise of the project.
What’s Broken or Fragile
Pipeline observability is just too foggy to me right now and that needs work. Logs, retries, and alerts are in place but not where they would need to be for production. There’s also no dashboard for pipeline health yet, but there certainly will be in the next versions.
CI/CD is more of an aspiration than a system right now. Docker builds work, but I want to incorporate Github Actions, and there’s no automated flow tying it all together yet.
What I Learned
Airflow’s the real deal when it comes to orchestration. I’ve only scratched the surface and I’m looking forward to digging deeper.
Plotly Dash surprised me — it’s more powerful than I expected and gives me a solid way to build dashboards without extra overhead.
Snowflake continues to rock. My favorite thing about Snowflake integration on this project was error-free CLI connections it made. So smooth. I also realized I need to think more in terms of data marts — not just raw and transformed layers, but how the data serves real use cases.
And finally: there’s something deeply satisfying about watching data flow hour by hour.
What’s Next
I'll be working with data that's more directly relevant to me — starting with an API key from the City of Portland. Housing data, Oregon state APIs, sensor feeds — anything that gives better visibility into how the city runs.
On the backend, getting a clearer picture of pipeline health through alerting and dashboard observability.
Everything’s getting Dockerized to keep it portable. And as the pieces come together, I’ll start folding it into a proper CI/CD flow.
Looking forward to building this out further and sharing my results. I'll keep writing if you'll keep reading. Deal?